Showing posts with label University. Show all posts

Tuesday, May 17, 2016

How unfair is access to university education?

The Times today has a leader, "First-Degree Burn", where they state:
"With notable exceptions, Britain’s universities are still not doing enough to attract poor students. English 18-year-olds from the most advantaged 20 per cent of backgrounds are still more than six times more likely to attend a top university than those from the least advantaged 20 per cent.

"Jo Johnson, the universities’ minister, calls this unacceptable and he is right."
In fact he is quite wrong.

---

Suppose 'advantage' is normally distributed in the UK population (it is not - more later) and suppose it correlates pretty well with IQ (which seems more reasonable).

Then the top 20% would have a mean IQ of 121 and their children (regressing to the mean) an average IQ of 117. *

The bottom 20% would be a symmetrical story, the left side of the bell curve. Their mean IQ would be 79 and their children's an improving 84 (83.2 but let's round up).

---

The Times mentions 'a top university', by which they most likely mean the Russell Group. The IQ needed to get into a Russell Group university is estimated to be 120.
 - Given a population with average IQ of 117, you would expect 42% to be eligible to meet the 120 cut-off.

 - Given a population with an average IQ of 84, you would expect 0.8% to be smart enough to meet the IQ 120 cut-off for the Russell Group.
That's a ratio of 42/0.8 = 52.5 - far worse than the lamentable six to one quoted by The Times.

The problem is with the financial-advantage model. The disadvantage-advantage distribution is far from normal; a small minority are very well off while a very large minority share a lowish level of income which is conventionally described as 'disadvantaged'.

What IQ amongst the 'disadvantaged' would replicate The Times' statistic of six to one?

A 'disadvantaged ' IQ of 98.

A population with an average child's IQ of 98 would have around 7% with an IQ at or above 120 - and thus be eligible to attend a 'top university'.

Since 98 is pretty much the average IQ of the mass of people in the UK, The Times' figures do not surprise me at all - they're exactly what we should expect.

And for that reason, despite any confected outrage or exciting new policies, I don't expect them to alter at all, short of crashing admission standards. **

---

* If you're wondering where all these figures came from, we're applying truncation selection ideas which were explained in detail here.


The first part of the calculation goes like this:

Talking about the top 20% of the population for IQ (mean = 100, std. dev. = 15) we have p = 20% = 0.2. This is the area we are 'breeding from', the top 20%.

The mean IQ of this group S = 100 + std. dev. * i(p) = 100 + 15 * 1.4 = 121,

... where we look up i = i(p) = i(0.2) = 1.4  in the table.

Using an IQ heritability of 0.8, the mean children's IQ = R = 100 + 0.8 * 21 = 116.8 = 117,

... reversion to the mean.

A symmetrical calculation give us the story for the bottom 20%

The rest is just putting numbers into the normal distribution.

---

** If pushed I'd say that the above analysis makes both the affluent and disadvantaged children too smart. As a reality check, what if we made the mean IQ of the advantaged kids 115 (1 sigma up) and the disadvantaged kids 95 (one third of a sigma down)? That sounds more like it.

Then 40% of the 'rich' kids could get into a Russell Group university, and 5% of the 'poor' kids. That's a ratio of eight to one. And The Times did hint that the ratio was worse than 6:1 ...

---

More bad science from The Times.

Friday, February 19, 2016

The Boys in the Bubble

Bagehot in "The Economist" today

Bagehot writes:
"BEING a Eurosceptic in a university city is a lonely business. In the drizzle outside the Cambridge Union a student in a roll-neck is trying to hand anti-EU leaflets to the cliques hurrying past. Most ignore him. One, having taken a folded piece of card, glances at it and sighs “nah”, shoving it back into the campaigner’s hand.

"Inside, in the neo-Gothic chamber, pro-EU luminaries ply their arguments to cheers. When Richard Tice, an anti-EU campaigner, delivers his speech students bob up and down, machine-gunning him rebarbative questions. Did regulation not exist before Britain joined the union? Why do so many firms support membership? If Britain doesn't control its borders why do foreign students struggle to get visas?

"When Mr Tice quotes “the highly respected economist, Tim Congdon” (a notorious Eurosceptic) the chamber resounds to laughter and sarcastic applause."
Things are different in Peterborough.
"Compare that with Peterborough, a similarly sized city at the other end of Cambridgeshire. At a public debate there locals voted decisively in favour of Brexit. “I asked rhetorically what the audience would put at risk to leave the EU,” recalls Mr Huppert. “They shouted back: ‘Everything’.”
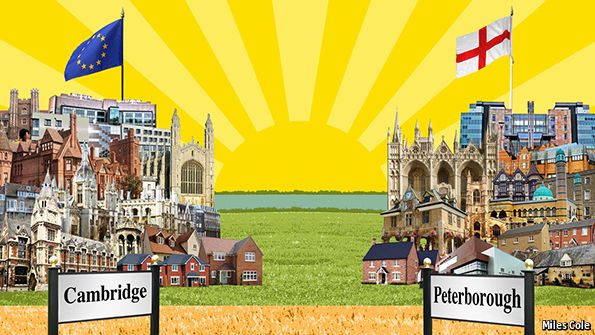
Cambridge and Peterborough are geographically close and in many ways quite similar, so why the different attitudes to the EU?
"Cambridge bears the hallmarks of an economy in which one in two has gone to university, Peterborough is visibly a city of school-leavers.

"When it comes to the EU, this difference is everything. Education levels are “an extremely strong predictor” of an individual’s views on the subject, stresses Robert Ford, an expert on public opinion: the more qualifications someone has, the more pro-European he or she is likely to be.

"According to polls by YouGov, those educated only to 16 oppose EU membership by 57% to 43%, but among graduates it is 38% to 62%. When education is controlled for, other factors affecting an individual’s views on Europe—like income, choice of newspaper and even age—diminish.

What is it about those five years of study between 16 and 21? The answer has two parts. First, the self-interested one. “Having a degree is increasingly a prerequisite of getting on in life,” observes Mr Ford, adding: “Both sides are aware that there is a drawbridge called university and that those who don’t get across it are disadvantaged.”

[...]

"The second, cultural driver mostly concerns immigration. Whereas many in Cambridge see incomers as highly educated Germans and Swedes bringing their expertise to research projects, start-ups and product-development meetings, in Peterborough they are Lithuanian potato-pickers who, if not competing with locals for unskilled work, are at least nipping at their heels."
The Economist has sussed out the underlying trend though:
"University attendance has exploded, which suggests that Britain will become more internationalist and comfortable with EU co-operation. Yet in the meantime it seems the country will be increasingly polarised: liberal, Cambridge-like places on the one side; nationalist, Peterborough-like ones on the other and an ever-shrinking middle ground between the two, as the population bifurcates into those whose skills make them globally competitive and those who must compete with robots and the mass workforces of the emerging economies.

[...]

"Eventually Britain will look more like Cambridge than it does today."
In the year after taking A-level (i.e. at age 18+) 52% of young people were at a higher education institution - with one per cent at Oxbridge and another 8% at other Russell Group universities, according to a Government report.*

So Oxbridge is taking the top 1% of the population age-cohort and inducting them into an international elite bubble. I feel it is unlikely, short of the initiative described in my previous post, that very much more of Britain 'will look more like Cambridge in the future than it does today'.

There are better, more forward-thinking arguments which might speak to Oxbridge undergraduate as to the merits of leaving the present incarnation of the Holy Roman Empire. But that's for another day ... although ironically, The Economist got there before me.
___

Update: (March 18th 2016): see also "Brexit: the issue is Germany".

---

* These figures are interesting. If the 1% admitted to Oxford and Cambridge were selected entirely on merit, the IQ cut-off would be z = 2.33 SD, or 135. If you believe that some get into Oxbridge by not being quite as bright as that, but by having connections, then the merit IQ threshold will be greater than 135.

For the Russell Group  (the top 24 non-Oxbridge including my own alma mater, Warwick), you have to be in the top 9%. This requires z > 1.34, or an IQ of at least 120. In practice, IQ demands are likely to be less for non g-loaded subjects like English and Drama (plus there are those connections again), so this is very much a lower bound for disciplines positively requiring high-IQ (typically STEM subjects and philosophy).

---

We were in the Cribbs Causeway Mall today, pictured below, where I replaced my Primark trousers with softer and more luxurious variants from John Lewis at seven times the price.

The author at Cribbs Causeway Mall

I also popped into my first Apple store. I was expecting style and imagination, but was confronted by six large Formica-like tables upon which were arrayed rows of tethered iPhone 6s and MacBook Air laptops. The whole experience seemed tacky and impoverished; the shop was, however, crowded.

Sunday, March 22, 2015

Social class differences in IQ

Since life is an IQ test it follows that in a meritocracy the upper echelons of society will be brighter than those at the bottom. How much brighter?

Details were documented by Bruce Charlton (see below). You would have thought that the public policy implications would be of great importance leading to intense public debate. But then, that might make some people feel bad.

Anyway, here's Charlton's answer to the question posed above.
"Typically, the average IQ of the highest occupational Social Class (SC) - mainly professional and senior managerial workers such as professors, doctors and bank managers - is 115 or more when social class is measured precisely, and about 110 when social class is measured less precisely (eg. mixing-in lower status groups such as teachers and middle managers).

"By comparison, the average IQ of the lowest social class of unskilled workers is about 90 when measured precisely, or about 95 when measured less precisely (eg. mixing-in higher social classes such as foremen and supervisors or jobs requiring some significant formal qualification or training)."
And here's an excerpt from his paper.
Social class differences in IQ: implications for the government’s ‘fair access’ political agenda

Bruce G Charlton

"Since ‘the Laura Spence Affair’ in 2000, the UK government has spent a great deal of time and effort in asserting that universities, especially Oxford and Cambridge, are unfairly excluding people from low social class backgrounds and privileging those from higher social classes. Evidence to support the allegation of systematic unfairness has never been presented, nevertheless the accusation has been used to fuel a populist ‘class war’ agenda.

"Yet in all this debate a simple and vital fact has been missed: higher social classes have a significantly higher average IQ than lower social classes.

"The exact size of the measured IQ difference varies according to the precision of definitions of social class – but in all studies I have seen, the measured social class IQ difference is substantial and of significance and relevance to the issue of university admissions.

The existence of substantial class differences in average IQ seems to be uncontroversial and widely accepted for many decades among those who have studied the scientific literature. And IQ is highly predictive of a wide range of positive outcomes in terms of educational duration and attainment, attained income levels, and social status (see Deary – Intelligence, 2001).

"This means that in a meritocratic university admissions system there will be a greater proportion of higher class students than lower class students admitted to university.

"What is less widely understood is that – on simple mathematical grounds – it is inevitable that the differential between upper and lower classes admitted to university will become greater the more selective is the university.

***

"There have been numerous studies of IQ according to occupational social class, stretching back over many decades. In the UK, average IQ is 100 and the standard deviation is 15 with a normal distribution curve.

"Social class is not an absolute measure, and the size of differences between social classes in biological variables (such as health or life expectancy) varies according to how socio-economic status is defined (eg. by job, income or education) and also by how precisely defined is the socio-economic status (for example, the number of categories of class, and the exactness of the measurement method – so that years of education or annual salary will generate bigger differentials than cruder measures such as job allocation, postcode deprivation ratings or state versus private education).

"In general, the more precise the definition of social class, the larger will be the measured social class differences in IQ and other biological variables.

"The non-symmetrical distribution of high and low social class around the average of 100 is probably due to the fact that some of the highest IQ people can be found doing unskilled jobs (such as catering or labouring) but the lowest IQ people are very unlikely to be found doing selective-education-type professional jobs (such as medicine, architecture, science or law).

"In round numbers, there are differences of nearly two standard deviations (or 25 IQ points) between the highest and lowest occupational social classes when class is measured precisely; and about one standard deviation (or 15 IQ points) difference when social class (SC) is measured less precisely.

"I will use these measured social class IQ differences of either one or nearly two standard deviations to give upper and lower bounds to estimates of the differential or ratio of upper and lower social classes we would expect to see at universities of varying degrees of selectivity.

"We can assume that there are three types of universities of differing selectivity roughly corresponding to some post-1992 ex-polytechnic universities; some of the pre-1992 Redbrick or Plateglass universities (eg. the less selective members of the Russell Group and 1994 Group), and Oxbridge.

"The ‘ex-poly’ university has a threshold minimum IQ of 100 for admissions (ie. the top half of the age cohort of 18 year olds in the population – given that about half the UK population now attend a higher education institution), the ‘Redbrick’ university has a minimum IQ of 115 (ie. the top 16 percent of the age cohort); while ‘Oxbridge’ is assumed to have a minimum IQ of about 130 (ie. the top 2 percent of the age cohort).
...
"When social class is measured precisely, it can be seen that the expected Highest SC to Lowest SC differential would probably be expected to increase from about three-fold (when the percentages at university are compared with the proportions in the national population) in relatively unselective universities to more than thirty-fold at highly selective universities.

"When using a more conservative assumption of just one standard deviation in average IQ between upper (IQ 110) and lower (IQ 95) social classes there will be significant differentials between Highest and Lowest social classes, increasing from two-fold at the ‘ex-poly’ through four-fold at the ‘Redbrick’ university to nine-fold at ‘Oxbridge’.

"In other words, according to social class definitions, the average child from the highest social class is from nine-to-thirty times more likely to qualify for admission to a highly selective university than the average child from the lowest social class."
So that was back in 2008. And seven years later, politicians are still not conceding the inevitability of elitism or that the unskilled labouring classes are, on average, not too bright.

Amazing.

Friday, November 07, 2014

"What's my IQ?" (You ask yourself)

Lots of people haven't taken IQ tests, or maybe they did but their company declined to share the results. But calm yourselves: there is a way. Recall that one of the major utilities of IQ test results is that they correlate strongly with competence in occupations requiring intelligence. So naturally, you can reverse-engineer your IQ from your occupation or education, or at least establish a personal floor level.

Let's start with university. In the UK, along with many industrialised societies, something like 40% of the cohort go to university. This sets the entrance level at the 60th percentile. Looking up the value of 0.1 (corresponds to 0.6 = 0.5 + 0.1) in a normal distribution table tells us that this occurs at 0.25 standard deviations to the right of the mean. Since IQ is normed at mean = 100, standard deviation = 15, the minimum IQ to get into university these days is about 104.

Obviously if this is your IQ you're going to be doing media studies or drama, not economics, mathematics or physics. It's a floor.

Now we turn to another useful chart, this time from Steve Hsu via Lubos Motl. I reproduce part of Lubos' rather satirical post below. Steve Hsu's original data was GRE (Graduate Record Examinations) scores, which he then translated into IQ scores. The GRE are taken by most American university graduates seeking to do post-graduate study to PhD level. Anyway, here's Lubos:
"Steve Hsu has found a very interesting table with the average GRE scores computed for various concentrations. He has also defined a linear map translating the average V-Q-A scores into a more familiar IQ scale. This convention looks natural to me and I will follow his scale although it is not guaranteed that it is equally calibrated as other IQ measurements.

"Disclaimer: these cold numbers expressing typical IQ for different occupations must be interpreted very carefully. They don't necessarily imply anything. The outcome depends on the character of the question, discrimination, etc. Despite different numbers, all of us are equal. Blah blah blah. And so on.

"The results are: [A PhD student's typical IQ for this subject]

130.0 Physics
129.0 Mathematics
128.5 Computer Science
128.0 Economics
127.5 Chemical engineering
127.0 Material science
126.0 Electrical engineering
125.5 Mechanical engineering
125.0 Philosophy
124.0 Chemistry
123.0 Earth sciences
122.0 Industrial engineering
122.0 Civil engineering
121.5 Biology
120.1 English/literature
120.0 Religion/theology
119.8 Political science
119.7 History
118.0 Art history
117.7 Anthropology/archeology
116.5 Architecture
116.0 Business
115.0 Sociology
114.0 Psychology
114.0 Medicine
112.0 Communication
109.0 Education
106.0 Public administration"
Since these are graduate entry levels, they're creaming off the top end of undergraduates. So it's kind of an 'undergraduate good 2:1' floor we're seeing here. Oh, and scary & surprising about US doctors, don't you think? In the UK, the average IQ of medical students is reckoned to be 125 (page 61).

At the very top-end, Steve Hsu has observed:
"I doubt that the average among eminent scientists (averaging over all fields) is 160; probably a bit lower like 145."
Finally I draw your attention to "Smart Fraction" Theory, which examines the notion that to run a modern, complex, industrialised society requires a mass of people with (verbal) IQs greater than around 106. Our best societies today have a smart fraction just under 50% (see graph at the bottom of the linked article).