 |
| The logistic distribution from John Cook's excellent overview |
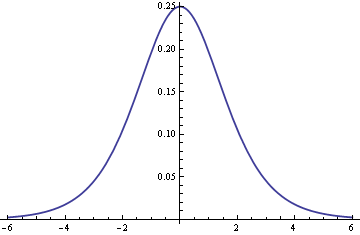
The derivative of the logistics curve (the cumulative number of cases in an epidemic) is the logistic distribution, which looks very much like a scaled normal distribution as John Cook explains.
His graph above shows you the number of active cases as time advances: starting low, rising to an epidemic peak and then dying away. [As I write we are at -3.5σ = -5.6].
The standard deviation to use σ = 1.6 according to John Cook's article.
The Times today carries a report which allows a prediction of the course of the epidemic in the UK. This is what the Chief Medical Officer had to say:
"Professor Whitty said that the peak of an outbreak was expected in about two months, with 50 per cent of cases over a three-week period and 95 per cent over a nine-week period."
Mapping this on to the normal distribution gives us a standard deviation of two and a quarter weeks (σ =2.29, call it 2.25).
Fifty percent of cases would be within two thirds of a standard deviation from the central point, which gives 2 * (2/3) * (2.25) = 3 weeks.
So the peak of cases would be two months time, early May: we are currently about three and a half standard deviations out (7.9 weeks).
Five weeks after the peak the epidemic should have burned itself out in the UK: mid-June.
So to summarise for the UK:
- Crisis (50%): end-April to first half of May (3 weeks)
- Peak: first week of May
- Burn-out: mid-June.
---
Why are you assuming that Covid-19 is described by a Logistics curve?
ReplyDeleteThere are several models of epidemics and the Logistics curve connects with a simple model, in which there is no recovery i.e. everybody becomes infected. This is known as the SIS model.
A more realistic model (with Recovery and Immunity) is the SIR model. This model does not follow the Logistic curve, but is a development of a classic Kendrick-McCormack model. This model has three differential equations (a little reminiscent of the Lorenz equations of Chaos theory!)
Its curve is asymmetric unlike the Logistics curve above (which is just sech^2(x)).
A curve like the above was shown in the Government's first presentation last week however. Nevertheless the notorious "herd immunity" (or indeed any sort of immunity) does not happen with the Logistic model....
Useful comment. I take your point. However, in the early phase the curves are all very similar (as recovered are a vanishingly small subset).
Deletehttps://en.wikipedia.org/wiki/Compartmental_models_in_epidemiology
Looking at the Neil Ferguson - ICL paper of 16th March, which is in the headlines now, I see that another modelling issue is involved.
ReplyDeleteThe "burn out" figure above is valid only if there is no mitigation strategy. According to that paper some (fairly extreme) mitigation strategies could cause no early summer peak at all: everything then gets pushed to around December 2020.
Presumably a more likely case is some mitigation and some peak, but then a resumption once mitigation is removed. Since "herd immunity" is not feasible without a vaccine, we may have 18 months + of heavy mitigation instead.
Certain assumptions and unknowns still underlay this mitigation model, however. Of particular relevance is what will actually happen in China as the recent controls are removed. (The China current data does not actually fit the above Logistic model because heavy mitigation was introduced.)
Will there be an (endogenous) resumption in China in the coming weeks as the ICL team are effectively assuming?