 |
| The logistic distribution from John Cook's excellent overview |
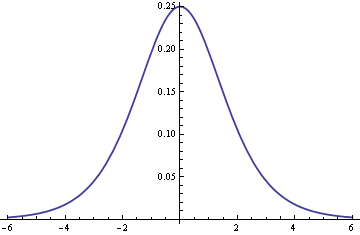
The derivative of the logistics curve (the cumulative number of cases in an epidemic) is the logistic distribution, which looks very much like a scaled normal distribution as John Cook explains.
His graph above shows you the number of active cases as time advances: starting low, rising to an epidemic peak and then dying away. [As I write we are at -3.5σ = -5.6].
The standard deviation to use σ = 1.6 according to John Cook's article.
The Times today carries a report which allows a prediction of the course of the epidemic in the UK. This is what the Chief Medical Officer had to say:
"Professor Whitty said that the peak of an outbreak was expected in about two months, with 50 per cent of cases over a three-week period and 95 per cent over a nine-week period."
Mapping this on to the normal distribution gives us a standard deviation of two and a quarter weeks (σ =2.29, call it 2.25).
Fifty percent of cases would be within two thirds of a standard deviation from the central point, which gives 2 * (2/3) * (2.25) = 3 weeks.
So the peak of cases would be two months time, early May: we are currently about three and a half standard deviations out (7.9 weeks).
Five weeks after the peak the epidemic should have burned itself out in the UK: mid-June.
So to summarise for the UK:
- Crisis (50%): end-April to first half of May (3 weeks)
- Peak: first week of May
- Burn-out: mid-June.
---

