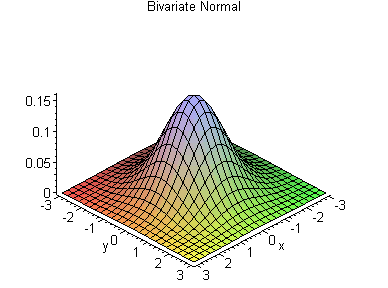
Your brother or sister could be exactly the same intelligence as yourself, but that's not the way to bet. Yesterday I wrote about the Carl Shulman and Nick Bostrom paper, "Embryo Selection for Cognitive Enhancement: Curiosity or Game-changer?". They said that the average distance in intelligence between two siblings was 8.4 IQ points.
Hmm.
When I saw that figure I was mightily impressed by their mathematical skills. After much thinking I decided that what they had done was this. They had taken the Gaussian distribution for the IQ of offspring with
mean = parental midpoint IQ; standard deviation = 7.5,and considered two random variables from this distribution. Let's call them, with a bow to genetics, X for daughter and Y for son.
They had then computed the expected value of abs(X-Y). The absolute value is important here: the expected value of the mere difference (X-Y) is zero, as one sibling taken at random will on average be no brighter or dimmer than the other.
I hate these messy integrals incorporating the bivariate Gaussian distribution with weird boundaries! And apparently so do Carl and Nick: they got their answers by simulation.
But there is another way where we can still be analytic. The answer is in the power of four.
Take four coins and toss them. Count the number of heads - there are five possible outcomes: 0. 1. 2, 3, 4. The respective probabilities are 1/16, 4/16, 6/16, 4/16. 1/16.
The mean number of heads is 2 and the standard deviation of the number of heads is 1. How convenient.
[SD = √(npq) = √(4 * 0.5 * 0.5) = 1].
When you draw the histogram you get something like the above, which is not a million miles away from looking rather ... normal.
If we wanted to make this about sibling intelligence, map the number of heads into IQ scores:
2 heads = IQ 100Warning, IQ can go down as well as up.
3 heads = IQ 107.5
4 heads = IQ 115.
Now imagine if we had one set of four coins to our left "the daugher IQ" and another set to our right "the son IQ". Throw simultaneously and count the number of left heads and right heads.
The difference (abs, remember, absolute value) in the number of heads is the IQ difference - each head counts as 7.5 IQ points. What do we get?
There's a spreadsheet for that.
 |
| Each cell in the bottom table is the product of the corresponding cells in the top two |
Now these three tables are either self-evident after a little consideration, or too long to explain. I simply draw your attention to the figure in the bottom right in bold. The sum of all the entries in the third table = 1.09375.
This is the expected value of the difference in number of heads between left and right, "daughter" and "son" coin sets.
To change it into an IQ figure we multiply by 7.5 giving 8.2 ("my sister is 8 IQ points smarter than me!" ... or maybe conversely ...).
If we want the gap between each sibling's expected IQ from the mean expected IQ (over all possible siblings) we halve it to get 4.1. Think about it - don't you just love stats *.
This compares to Carl's and Nick's number of 4.2 based on ten million simulations (table below). Not a bad approximation to the normal distribution and you can see what's going on.
---
Admittedly, extending to the case of 'best of ten siblings' seems a few coin sets too far.
---
* and then I worry about this ...
which equates to 0.75 * 7.5 = 5.625 IQ points.
Time for a simulation ...


No comments:
Post a Comment
Comments are moderated. Keep it polite and no gratuitous links to your business website - we're not a billboard here.